Macrograph Report - Issue #2 Aug. 21, 2025
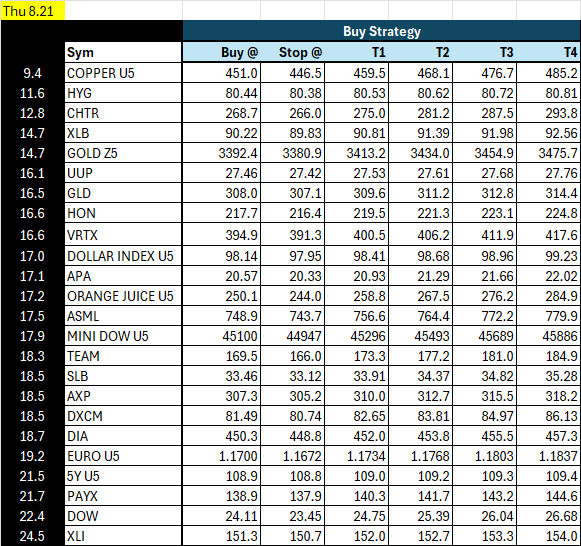
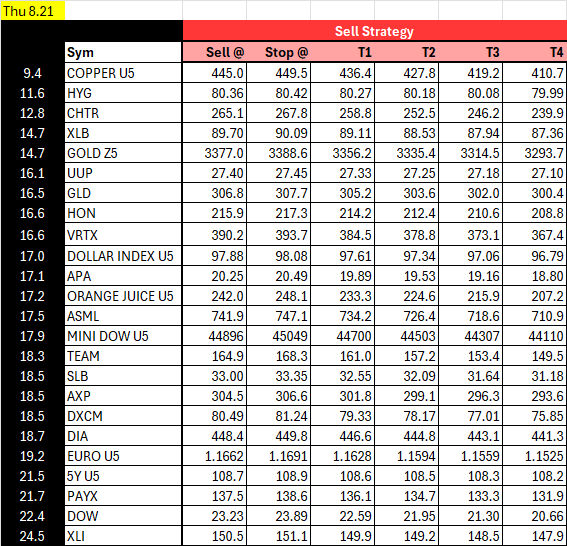
You will find today's signals below. As always, they cover both bullish and bearish scenarios. Some may want to choose just the top position, some may choose top 3, and some might prefer to trade the entire list or enter any other number of trades - that's a decision for you to make.
Remember the key rule: once any trade moves into profit, immediately move your stop to breakeven – significantly limiting the risk while keeping the upside potential.
Let's get started.
Today’s Trading Opportunities
Symbols are in order of trend potential (the higher on the list, the higher quality the signal is in my view). Trade management suggestions are below the tables.
How to Use
General info
This system is designed to catch above-average vertical moves. For equities, long positions are preferred. Long puts or bearish option spreads may be best for short-side signals.
Ideally, Target 2 (T2) will come into play within 24 hours. T3 may take 48 hours or more to achieve.
Buy stop orders may be used to get long
Sell stop orders may be used to get short
Trades in stocks and ETFs may work better if entry occurs 30 minutes after the opening or in the last 30 minutes of the session. You may enter trades at any time, but the suggested times may increase the odds for more profitable trades.
Futures
Futures open at various times. Suggested entry times are listed below.
Treasuries, metals, currency: 8 AM CT or later is the preferred entry time.
Stocks, agricultural and livestock: 9 AM CT (10 AM ET) or later.
Softs: best to start 7:30 AM CT / 8:30 AM ET.
LONG Positions - Finer Points
Go long if the price moves above the BUY@ level. Use sell stop orders to set RISK.
If T1 (target 1) is hit, move the stop to entry. You may choose to take some profit after each target is reached.
If T2 is realized, move the stop to T1 and so on.
§ This will be the trailing stop technique for now. After each target is hit, move the stop up to the previous target.
SHORT Positions - Finer Points
Go short if the price moves below the SELL@ level. Use buy stop orders to set RISK.
If T1 (target 1) is hit, move the stop to entry. You may choose to take some profit after each target is reached.
If T2 is realized, move the stop to T1 and so on.
§ This will be the trailing stop technique for now. After each target is hit, move the stop down to the previous target.
Risk Management Framework
Here's what 32 years in the markets has taught me: traders who survive and thrive aren't the ones who are right most often – they're the ones who manage risk systematically.
The Professional Approach: Never risk more than 1.5% of your total portfolio value on any single trade. This isn't conservative – it's essential for long-term success.
Position Sizing Made Simple:
$50,000 account = Maximum $750 risk per trade
$100,000 account = Maximum $1,500 risk per trade
$250,000 account = Maximum $3,750 risk per trade
Calculate Your Position Size: Risk Amount / Distance to Stop Loss = Maximum Position Size
Example: $1,500 risk / $3.00 stop distance = 500 shares maximum
Use the Golden Meadow® Portfolio Calculator to calculate your optimal position sizes. The calculator integrates with the comprehensive Golden Meadow® Portfolio Strategy framework for systematic wealth building.
Why This Matters: Even if you're wrong on multiple consecutive trades, you'll still have capital to deploy when the highest-probability opportunities arise. That's how institutional traders approach risk – preservation first, profits second.
To your profitable success,
John T. Seguin
Senior Market Analyst & MacroGraph Creator
Author, MacroGraph Report
Important Disclaimer: This analysis is for educational purposes only and does not constitute investment advice. Trading involves substantial risk of loss and may not be suitable for all investors. Always conduct your own research and consider consulting with qualified financial advisors before making investment decisions.