Silver Catalyst #1 - Dec. 1, 2025
The Catalyst Intelligence Report for Silver Investors
Issue #1 | December 1, 2025
Welcome to the inaugural issue of Silver Catalyst. Two weeks ago, I published "Silver Rising: 100 Reasons Why Silver Will Soar." Within days, silver reached its all-time high of $56.86 per ounce. This newsletter continues the book's mission: tracking the 100 fundamental catalysts driving silver's transformation using the same engineering methodology that identified this opportunity before the broader market caught on.
This bi-weekly report doesn't provide stock picks or macro-economic philosophy. Others do that well. What I provide is catalyst intelligence: systematic tracking of which forces are accelerating, which are stalling, and what that means for silver's trajectory. Think of this as your radar system for silver market dynamics.
CATALYST DASHBOARD: December 2025 Update
The catalysts below saw significant probability changes during November. Each catalyst is scored on Price Impact (how much it could affect silver prices) and Probability (how likely it is to materialize). The Composite Score multiplies these together (maximum 25).
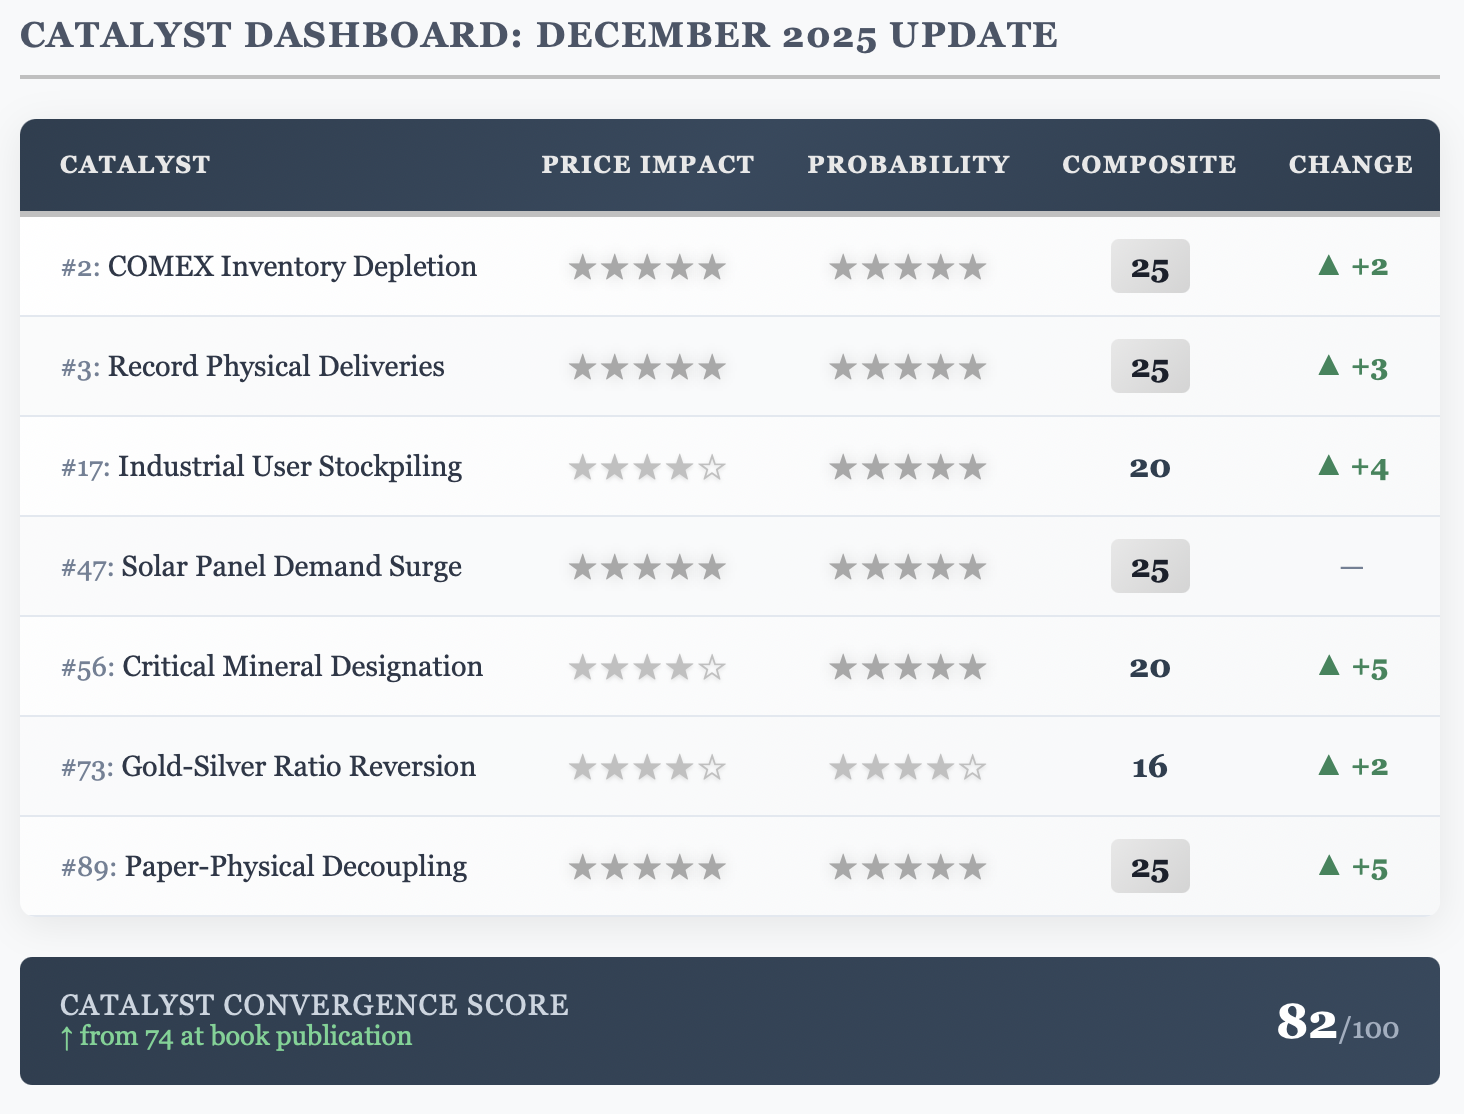
The 8-point jump in our Convergence Score reflects November's extraordinary developments. Three catalysts hit maximum probability scores. This level of simultaneous catalyst acceleration is unprecedented in my tracking.
THIS ISSUE'S DEEP DIVE: Catalyst #89 - Paper-Physical Decoupling
The November 28 Revelation
On November 28, 2025, a cooling system failure at CyrusOne's Chicago data center halted CME/COMEX trading for approximately 10 hours. What happened during that blackout tells you everything you need to know about the current state of silver markets.
Price discovery shifted entirely to physical markets. Silver surged to its all-time high of $56.86 per ounce. Shanghai futures reportedly hit record highs during the outage. When COMEX reopened, silver surged sharply as paper markets scrambled to catch up with physical reality.
This wasn't a glitch. It was a revelation.
The Mathematics of Decoupling
The paper-to-physical ratio currently stands at levels worth monitoring. Using registered silver (the metal actually available for delivery) against total open interest provides one measure of market stress.
Here's the arithmetic. According to the latest CME depository statistics (November 28, 2025), COMEX registered inventory - the metal actually available for immediate delivery - stands at approximately 138.3 million ounces. Total eligible inventory adds another 318.5 million ounces, bringing the combined total to 456.8 million ounces. Total open interest represents roughly 862 million ounces of paper claims. The ratio of paper claims to registered inventory remains elevated at approximately 6:1, signaling structural stress in the delivery system.
This isn't speculation. This is arithmetic.
November's Stress Test
November provided the empirical validation I discussed in Chapter 6 of the book. Consider the sequence:
COMEX total inventories fell to approximately 457 million ounces by late November, down from October's record highs above 530 million ounces
Approximately 48-75 million ounces left COMEX vaults between October and late November according to various reports
London lease rates spiked to 35-40% during October-November 2025, peaking at 39% on October 9 - the highest since 1980
The lease rate spike deserves particular attention. Normal lease rates run below 1%. When borrowing silver costs 35-40% annually, something fundamental has broken. Bernard Dahdah of Natixis noted that parties borrowing silver were "willing to pay rather than earn interest" - an extremely rare condition that signals wholesale market tightness.
Backwardation: Why This Time Matters
Silver entered severe backwardation beginning around October 2, 2025, with the spot price exceeding futures prices by as much as $2.88 per ounce at peak intensity (October 10-12) - wider than during the 1980 Hunt Brothers episode. Every contract through late 2026 traded below spot. As of late November, backwardation persisted.
In a normally functioning market, futures trade above spot to account for storage and financing costs. When futures trade below spot, it means market participants are willing to pay more for immediate delivery than future delivery. They need the metal now.
The backwardation reached 20% on an annualized basis. Bruce Ikemizu of the Japan Bullion Market Association declared: "Silver squeeze is on. This is serious."
But here's the critical question for investors: What does backwardation normalization tell us about future price direction?
To answer this, I analyzed every major backwardation episode since 1980. The results challenge conventional wisdom.
HISTORICAL ANALYSIS: Silver Backwardation Episodes and What Followed
The central pattern is clear: backwardation normalization is NOT inherently bearish. What matters is WHY it normalizes.
When backwardation resolves due to natural supply response mid-rally, prices typically continue rising for weeks or months. When normalization coincides with forced liquidation or exchange intervention, it marks an immediate top. Across five major episodes since 1980, the rally continued 40-140% after normalization in two cases, while prices collapsed immediately in two others.
Episode 1: The 1979-1980 Hunt Brothers Squeeze
The Hunt Brothers' accumulation of approximately 195 million ounces drove spot prices to premium over futures by late 1979. Backwardation peaked on January 17-18, 1980, exactly when silver hit $49.45 (London Fix).
The critical insight: Backwardation did NOT resolve before the peak - it resolved simultaneously with the collapse. Exchange interventions triggered both normalization and the crash:
January 7, 1980: COMEX adopted "Silver Rule 7" with 3 million oz monthly position limits
January 17-18, 1980: Peak price ($49.45 London Fix, $50.35 COMEX intraday)
January 22, 1980: CBOT suspended all new silver futures
Late January 1980: Backwardation diminishing as prices fell
March 27, 1980: Silver Thursday - margin calls triggered 50% single-day crash to $10.80
Post-normalization trajectory: Prices fell 78% from peak to Silver Thursday in just 68 days. The ultimate low of $4.90 in June 1982 represented a 90% decline from peak.
Verdict: In this episode, backwardation normalization was bearish - but only because it coincided with forced liquidation from exchange intervention, not natural supply response.
Episode 2: The 1997-1998 Buffett Accumulation
Warren Buffett's Berkshire Hathaway accumulated 129.7 million ounces between July 1997 and January 1998 at an average cost of approximately $5.01/oz. His demand for physical delivery created acute supply stress.
Backwardation appeared February 4-5, 1998 (shortly after Buffett's February 3 public announcement), with lease rates spiking to 75% annualized. The peak of $7.81 occurred on February 6, 1998 - just 2-3 days after backwardation appeared.
Backwardation normalized around March 18-20, 1998, at approximately $5.85 - after prices had already fallen 25% from peak.
Post-normalization performance:
3 months later: -11%
6 months later: -17%
12 months later: -13%
Verdict: When backwardation normalizes after the peak is already in, further declines follow. The normalization itself was not the signal - the peak had already passed.
Episode 3: The 2010-2011 Silver Rally - The Instructive Case
This episode is the most instructive for understanding when backwardation normalization can be a mid-rally event rather than a top signal.
According to Monetary Metals CEO Keith Weiner, the December 2010 contract entered backwardation on November 11, 2010 at $27.75. The May and December 2011 contracts exited backwardation in early March 2011 at approximately $34-35.
Weiner's key observation: "By then silver was in a mini-mania. Its price went parabolic for a while and there was no stopping it, even though the structural dynamics which had originally driven it to rise were no longer present."
Post-normalization trajectory to peak:
Early March 2011 (normalization): $34.50
March 28-31, 2011: $36.62-37.87 (+9%)
April 8, 2011: $40.22 (broke $40)
April 18, 2011: $42.79
April 25, 2011: $49.82 intraday high (+43% from normalization)
Time from backwardation resolution to peak: approximately 7-8 weeks with 43% additional gains.
The crash came later, triggered by margin hikes - five margin increases in thirteen days raising requirements 84%. This was exchange intervention, not natural market dynamics.
Verdict: Backwardation normalization was a mid-rally event. The structural dynamics that caused backwardation had resolved, but momentum carried prices 40%+ higher before exchange-imposed margin hikes triggered collapse.
Episode 4: March 2020 COVID Disruption
The pandemic created the most severe physical delivery disruption in decades due to refinery closures, flight cancellations, and bar-size incompatibility between London (400oz) and COMEX (1000oz).
The EFP (Exchange for Physical) spread widened dramatically versus normal levels. Backwardation persisted from late March through early June 2020. Resolution came through massive metal transfers to COMEX vaults as logistics normalized.
Post-normalization trajectory:
March 19, 2020 low: $12.12
Late May 2020 (normalization): approximately $17
July 21, 2020: $21.03 (+73% from low)
August 6, 2020: $29.78 (+146% from low, +75% from normalization)
Verdict: Backwardation normalization (late May/early June) preceded the peak by 2+ months with substantial additional gains. The supply-chain nature of this backwardation - once resolved - did not prevent the rally from continuing.
Episode 5: February 2021 WallStreetBets Attempt
Brief backwardation appeared on February 1, 2021. By February 2 close, the market had normalized back to contango.
Silver peaked around $28-30 on February 1, 2021. CME announced margin hikes effective February 2 (an 18% increase). Silver fell sharply immediately.
Why the squeeze failed:
Speculators were already net long silver (no shorts to squeeze)
Silver market is approximately 20-75x larger than GameStop's market cap was at the time
Trading volume across London and COMEX dwarfs retail buying power
Verdict: Backwardation lasted only approximately 1 day and normalized essentially at the peak. This was immediate bearishness - but the backwardation itself was so brief it provided no predictive signal.
THE 2025 EPISODE: What History Suggests
The current 2025 backwardation is the most severe and prolonged since 1980, but driven by structural supply deficits rather than speculative corners.
Key timeline:
October 2, 2025: Deep backwardation begins at approximately $47-48
October 10-12, 2025: Peak intensity at $2.88 spread (20% annualized)
October 9, 2025: Lease rates peak at 39%
November 28, 2025: Backwardation persists; price hits $56.86 all-time high
Critical observation: As of November 28, 2025, backwardation has NOT normalized. This is now approximately 8 weeks of persistent backwardation - longer than any episode except the Hunt Brothers squeeze.
What category does 2025 fit?
Based on historical patterns, three distinct outcomes exist:
Category A: Normalization WITH forced liquidation = Immediate crash Examples: 1979-1980, February 2021
Exchange intervention triggers forced selling
Normalization coincides with or follows price peak
Immediate declines of 30-78%
Key indicator: Regulatory/exchange action immediately precedes normalization
Category B: Normalization WITH peak during demand-driven squeeze = Gradual decline Example: 1997-1998 Buffett
Peak occurs within days of backwardation onset
Normalization follows the peak by weeks
Declines of 11-17% over subsequent months
Key indicator: No forced liquidation, but demand catalyst exhausted
Category C: Normalization during structural rally = Substantial further gains Examples: 2010-2011, March 2020
Backwardation resolves due to natural supply response
Rally continues for 7-8 weeks (2011) or 2+ months (2020)
Additional gains of 40-75% after normalization
Key indicator: Physical supply-chain dynamics normalizing without forced liquidation
The 2025 setup most closely resembles Category C conditions:
Duration: 8+ weeks of backwardation mirrors the prolonged structural nature of 2010-2011, not the brief speculative spikes of 1997-1998 or February 2021
Structural drivers: This backwardation stems from the fifth consecutive year of supply deficit (95-149 million ounces), industrial demand growing approximately 7% annually while mine supply grows only 1-2%, and ETF holdings locking away 1.13 billion ounces globally. These are fundamental forces, not speculative corners.
No exchange intervention yet: Unlike 1980 and February 2021, no margin hikes or position limits have been implemented to trigger forced liquidation
Physical demand sources: Solar manufacturers, EV producers, and AI infrastructure builders need silver regardless of price. Indian Diwali buying shifted heavily to silver as gold exceeded $4,000. This demand is price-inelastic.
The key watchpoint is not the moment of normalization itself, but what causes normalization. Natural supply response suggests mid-rally event; forced liquidation suggests immediate top.
If backwardation normalizes through increased supply availability or reduced delivery demand - without exchange intervention - historical patterns suggest the rally could continue for weeks or months with potential gains of 40-75% from the normalization point.
GEOGRAPHIC DISLOCATION: A Global Squeeze
The crisis manifested geographically in ways that underscore physical tightness.
Shanghai: Futures Exchange inventories hit their lowest level since 2015. China exported a record 660 tonnes in October alone - primarily to ease London's supply squeeze - only to deplete domestic stockpiles just as peak Q4 demand season arrived. Shanghai entered backwardation with near-term prices exceeding futures, a classic indicator of acute physical scarcity.
London: LBMA vaults, after falling to multi-year lows earlier in 2025, received emergency inflows of 1,680 tonnes (54 million ounces) in October - the largest monthly increase in at least nine years. But TD Securities analyst Daniel Ghali estimated the London "free float" at only 155 million ounces, representing merely six weeks of global demand.
Metal is being flown across the Atlantic by chartered cargo planes at $75,000 per 300,000 ounce shipment to meet delivery obligations. That's not how commodity markets are supposed to work.
India: October imports exploded to $2.71 billion - a 528% year-over-year increase. Volume reached approximately 51.4 million ounces (1,600 tonnes), the 6th largest silver import month for India this century. India's merchandise trade deficit hit a record $41.68 billion in October, with precious metals as the primary cause.
What Changed the Probability Score
At book publication, I rated Catalyst #89 at 4 stars for probability (Composite: 20). November's developments warranted an upgrade to 5 stars (Composite: 25) for four reasons:
Empirical validation: The CME outage demonstrated that paper markets actively suppressed price discovery. When trading halted, prices immediately jumped to reflect physical reality.
Lease rate extremes: 35-40% lease rates aren't just elevated; they indicate that locating lendable silver has become genuinely difficult. Multiple market participants reported the same refrain: "Nobody's got silver."
Systemic response: The fact that banks withdrew from delivery activity while inventories drained suggests institutional recognition that the system is under stress.
Historical pattern match: The duration and structural nature of current backwardation most closely resembles episodes (2010-2011, March 2020) where normalization preceded substantial additional gains rather than marking tops.
MARKET CONTEXT: November's Record-Breaking Month
Silver gained 18.2% in November, reaching $56.86 on November 28 - a new all-time nominal high, surpassing both October 2025's $54.47 peak and the legendary 1980 Hunt Brothers high of $49.82. Year-to-date returns now exceed 84%.
The Critical Mineral Designation
On November 7, the U.S. Department of Interior published the Final 2025 List of Critical Minerals, adding silver for the first time among 60 designated minerals. This isn't symbolic. The designation activates Section 232 trade-review authorities, enables Defense Production Act invocation, and creates eligibility for federal funding and streamlined permitting.
The U.S. imports approximately 64% of silver consumed, with Mexico supplying the largest share. This designation acknowledges what industrial users already knew: silver is strategically indispensable, and supply chains are vulnerable.
Matthew Piggott of Metals Focus noted: "There's definitely going to be far more tightness in the silver market" as this designation takes effect.
Industrial Demand Approaches 700 Million Ounces
Industrial silver demand reached approximately 665 million ounces in 2025 according to the Silver Institute's November update - approaching but not yet crossing the 700 million ounce threshold as initially projected, due to accelerated silver thrifting in solar applications. Solar photovoltaic applications consumed an estimated 194-261 million ounces depending on the methodology. The shift to higher-efficiency TOPCon and HJT cell technologies - which require significantly more silver per cell - continues partially offsetting thrifting efforts.
The technology shift is dramatic:
TOPCon cells: 120mg silver per cell (rapidly becoming dominant in Chinese manufacturing)
HJT (Heterojunction) cells: 160mg silver per cell
N-type technology: Requires approximately double the silver per watt compared to older PERC technology
At current silver loading rates of approximately 0.4 oz/kW, a 500-megawatt solar array requires roughly 6-10 metric tonnes of silver depending on the cell technology employed.
China's solar buildout continues to accelerate - with approximately 240 GW already installed by September 2025 and full-year additions projected at 300-380 GW according to the State Grid Energy Research Institute. The IEA projects global solar capacity additions averaging 540 GW annually through 2035. Scale that globally, and solar alone creates demand growth that mining supply cannot match.
The Fifth Consecutive Deficit Year
The Silver Institute projects a 95-million-ounce deficit for 2025, marking the fifth consecutive year of structural shortfall. CPM Group projects a larger deficit of 206 million ounces. Cumulative deficits since 2021 now approach 820 million ounces - equivalent to nearly one year of global mine production.
The supply side cannot respond. Mine production peaked at 900.1 million ounces in 2016 and has declined approximately 7% since. New mine development requires 15.7 years on average. Even if a major new silver project received approval tomorrow, meaningful production wouldn't arrive until 2040.
This is the FORCE Framework in action: Fundamental deficit expanding, Ore grades declining, Ratio correcting, Consumption accelerating, Exchange inventories depleting. November demonstrated all five forces operating simultaneously.
Mining Sector Performance
The November price action translated into exceptional performance across silver mining ETFs:
SIL (Global X Silver Miners ETF): $77.66 on November 28, year-to-date return of +137.74%
SILJ (Amplify Junior Silver Miners ETF): $26.09 on November 28, year-to-date return of +132-157%
Major producers reported record Q3 2025 results. Hecla Mining delivered record revenue of $409.5 million with all-in sustaining costs of just $11.01/oz against average realized prices above $42/oz. First Majestic achieved record revenue of $285.1 million with 95% year-over-year growth. These margins are historically unprecedented.
ETF Accumulation Accelerates
Global silver ETF holdings reached 1.13 billion ounces - valued at over $40 billion, a record dollar amount (though volume remains approximately 7% below the February 2021 peak of 1.21 billion ounces). Aggregate silver ETF inflows totaled approximately $4.8 billion year-to-date through November 2025, compared to just $0.9 billion for all of 2024 - a five-fold increase.
The iShares Silver Trust (SLV) dominated flows:
5-day net inflows (late November): approximately +$564 million
6-month net inflows: +$1.79 billion
Year-to-date total return: +80.76%
On November 28 alone, strong inflows required SLV to purchase an additional 324 tonnes of silver - a substantial single-day acquisition that contributed to physical market stress.
A structural dynamic emerged: ETFs now hold more silver than LBMA London vaults in free float, creating systematic drain on physical liquidity.
Central Banks Discover Silver
In a historic development, central banks took their first silver positions in generations during 2025:
Saudi Central Bank became the first central bank to purchase silver (via ETFs) in August 2025 - acquiring 932,000 shares of SLV (approximately $30.6 million) and 203,700 shares of Global X Silver Miners ETF ($9.8 million). While modest relative to the Kingdom's total reserves, the signaling effect matters: a major petroleum-exporting nation is diversifying into silver alongside traditional gold holdings.
Russia announced in late 2024 that silver would be explicitly included in its State Fund purchases for the first time, alongside gold, platinum, and palladium. The 2025-2027 budget allocates 51.5 billion rubles (approximately $535-538 million) annually for precious metals and gemstones. While the specific silver allocation remains undisclosed, Russia is among the top ten global silver producers at approximately 38-40 million ounces annually - suggesting strategic domestic accumulation is feasible.
The precedent matters: if silver becomes part of central bank reserve strategies alongside gold, the demand implications are substantial.
SIGNALS TO WATCH: Key Indicators for December
1. December COMEX Deliveries
December is a major delivery month. The setup mirrors conditions that preceded October's delivery stress. Total deliveries exceeding 35,000 contracts would signal intensifying physical demand. Bank participation (or continued absence) will reveal dealer inventory conditions.
2. Backwardation Resolution - And How It Happens
This is the critical signal. If backwardation normalizes through:
Natural supply response (metal arriving, demand slowing) → likely mid-rally, potential for further gains
Exchange intervention (margin hikes, position limits) → likely immediate top, expect sharp correction
Monitor the EFP spread and lease rates daily. Lease rates sustained above 10% signal continued wholesale scarcity.
3. Gold-Silver Ratio Compression
The ratio fell to approximately 73-85:1 by month-end. The 20th century average sits at 47-50:1. Continued compression toward historical averages would indicate silver outperformance persisting into 2026. A move below 70:1 would represent significant technical confirmation.
4. India's December Imports
October saw India import $2.71 billion in silver - a 528% year-over-year increase. Wedding season continues through December. Strong import figures would confirm that India's demand surge represents structural change rather than one-time restocking.
5. Mexico Production Reports
Mexico's silver output is expected to decline 0.2% in 2025, with projections showing -2.9% CAGR (Compound Annual Growth Rate) through 2030 due to mine closures. Any additional closure announcements or production warnings would intensify supply concerns. Watch for news on the "Sovereign Resources" bill that would require strategic metals including silver to be refined domestically.
6. CME/Exchange Actions
The key bearish catalyst would be exchange intervention - margin hikes or position limits similar to 1980 or 2011. No such actions have occurred yet. If COMEX announces margin increases, the historical pattern suggests immediate price pressure regardless of underlying fundamentals.
CATALYST CONVERGENCE SCORE: METHODOLOGY
The Catalyst Convergence Score aggregates probability-weighted assessments across all 100 catalysts from "Silver Rising." Each catalyst's composite score (Price Impact × Probability) contributes proportionally to the total. Maximum possible score is 100.
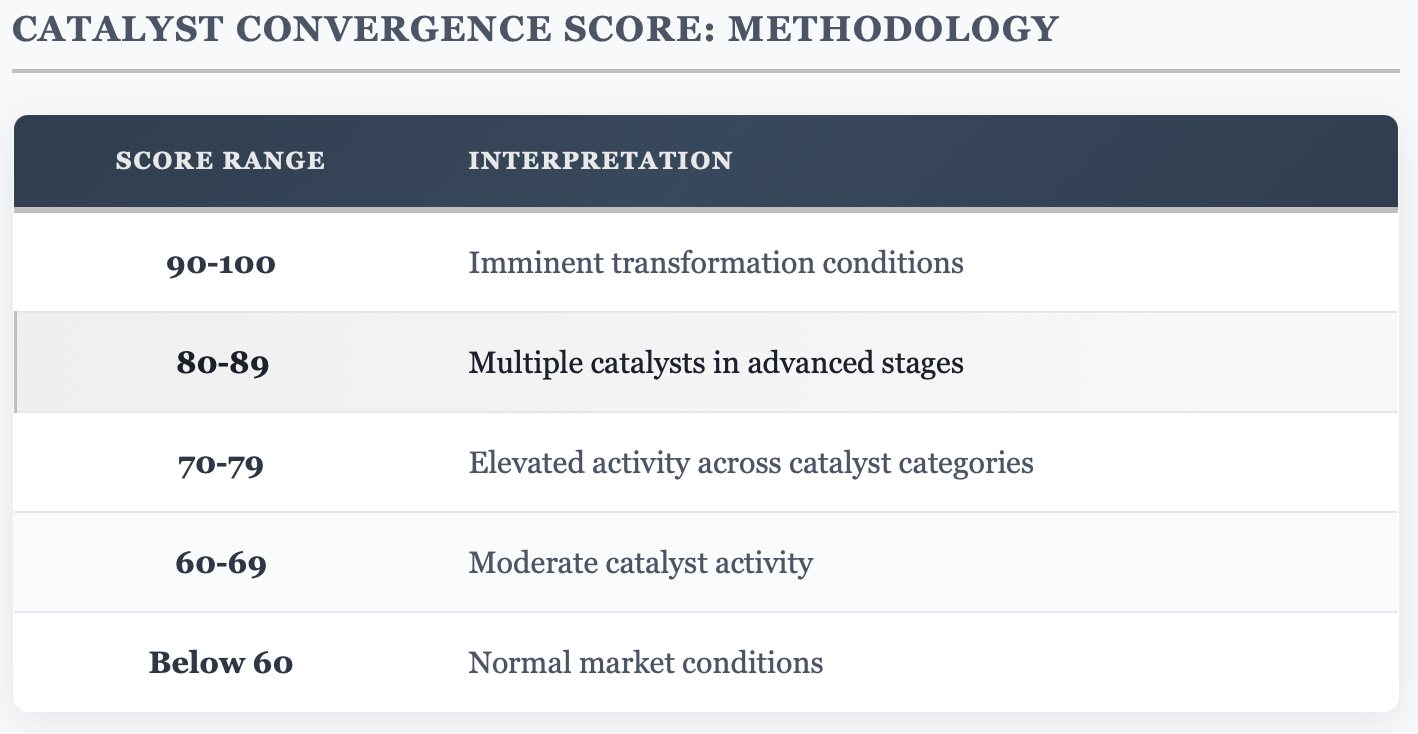
November's score of 82 represents the highest reading since I began systematic tracking. The 8-point increase from book publication reflects simultaneous acceleration across market structure, supply crisis, and geopolitical catalyst categories.
LOOKING AHEAD
December brings several potential catalyst developments:
FOMC Decision (December 9-10): Markets are pricing in a high probability of another 25 basis point cut. Lower rates reduce the opportunity cost of holding non-yielding assets, providing tailwind for precious metals.
Year-End Fund Flows: Institutional positioning ahead of 2026 could accelerate ETF accumulation. The pattern of late-month inflows may intensify.
China Export Controls: New silver export licensing requirements take full effect for 2026. Watch for any restrictions on December shipments that could further tighten Western supply.
The structural conditions that drove silver to all-time highs in November remain intact. The fifth consecutive deficit year continues. Industrial demand growth outpaces supply growth. Exchange inventories remain stressed despite geographic redistribution.
The historical pattern from 2010-2011 and March 2020 is instructive: when backwardation resolves through natural supply response rather than forced liquidation, the rally typically continues for weeks or months with substantial additional gains. Current conditions - structural deficit, industrial demand drivers, no exchange intervention - most closely match those episodes.
The catalysts are converging. The question is no longer whether the transformation will occur, but how quickly.
Thank you for joining me on this first issue of Silver Catalyst. Your support - whether through reading the book, subscribing to this newsletter, or simply engaging with the analysis - makes this research possible. I don't take that trust lightly.
The silver story is unfolding in real time. I'm grateful to have you alongside for the journey.
The Silver Engineer
P.S. Friends don't let friends miss historic investment opportunities. Whether someone chooses to position in silver is their decision - but if they haven't heard the silver story, they have no chance to decide, and thus no chance to participate.
You can gift "Silver Rising: 100 Reasons Why Silver Will Soar" for just $9. Your friend will also receive two weeks of complimentary access to Silver Catalyst - including this issue.
And here's a thank-you for spreading the word: when your friend accepts their gift, your own Silver Catalyst access extends by 30 days.
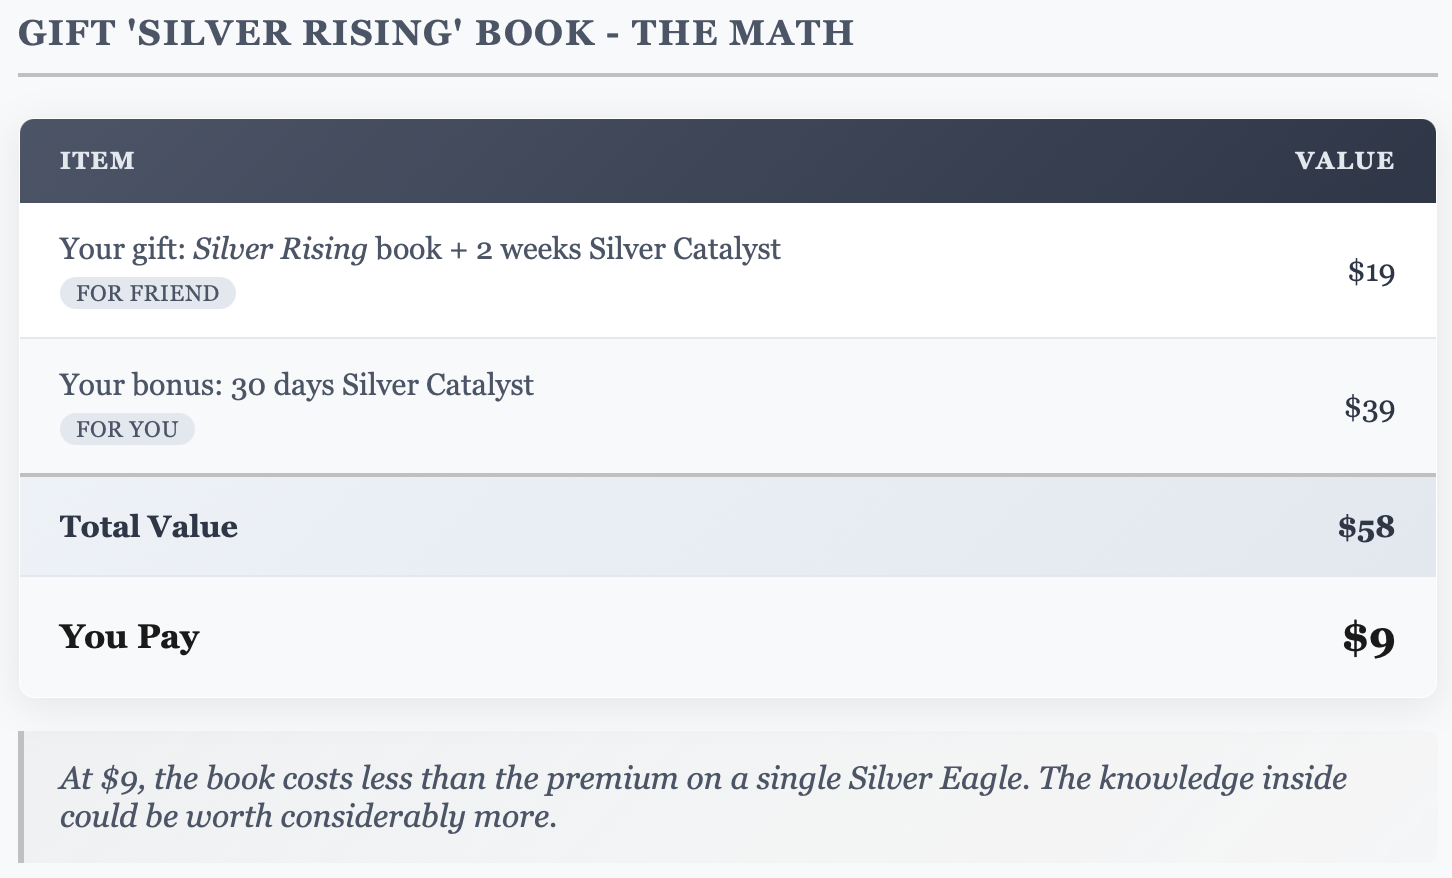
Gift the 'Silver Rising' book for just $9
Subscription Information
Silver Catalyst is a premium newsletter priced at $39 per month. You may be on a free trial (the regular trial is 2 weeks) based on your book purchase, but the subscription will renew normally unless cancelled. If you'd like to continue receiving these reports every two weeks, no action is required. If you don't want them, you can adjust your subscription preferences anytime.
About Silver Catalyst
Silver Catalyst is published bi-weekly by The Silver Engineer through Golden Meadow®. This newsletter provides catalyst intelligence for silver investors - tracking probability changes across the 100 fundamental catalysts driving silver market transformation.
This analysis represents my personal views based on publicly available information and the engineering methodology detailed in "Silver Rising: 100 Reasons Why Silver Will Soar." It does not constitute investment, legal, or tax guidance. Consult appropriate professionals before making investment decisions.
© 2025 Golden Meadow®. All rights reserved.